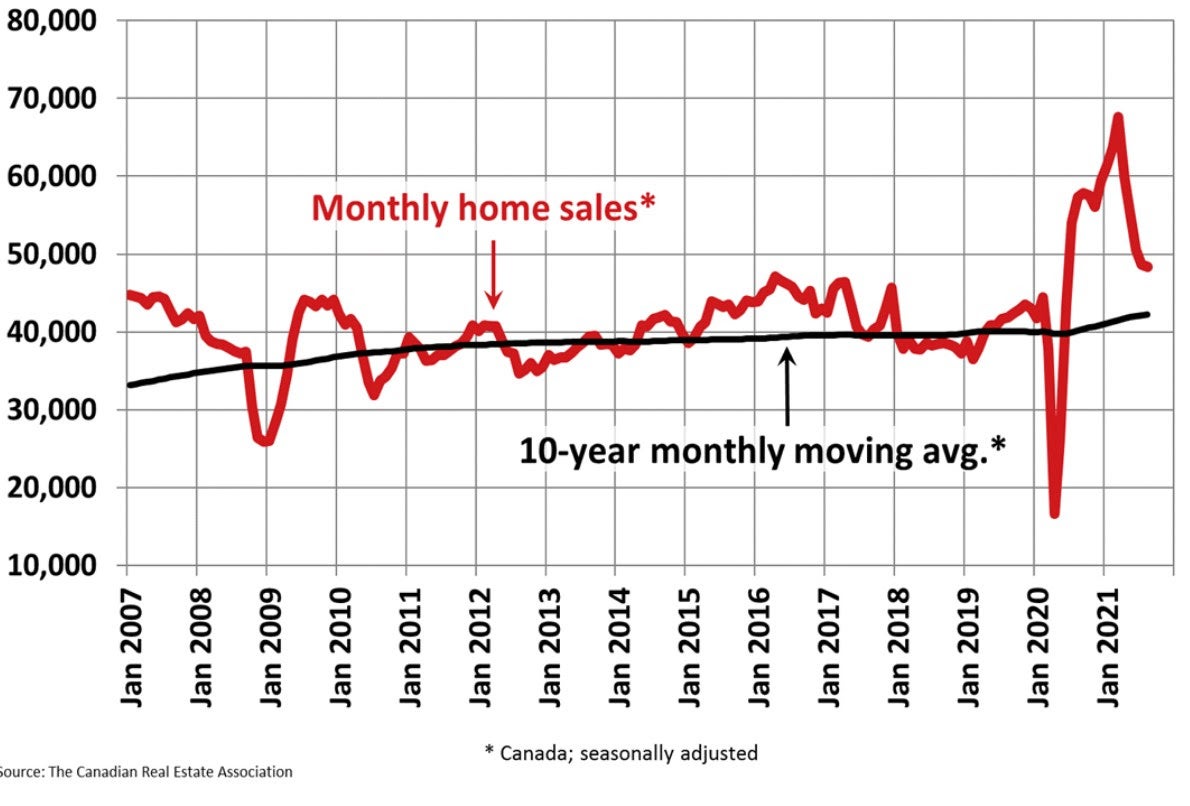
 Today the Canadian Real Estate Association (CREA) released statistics showing national existing-home sales rose 0.9% between August and September 2021, posting the first monthly gain since March (see chart below). On a year-over-year (y-o-y) basis, the number of transactions last month was down 17.5%. Nevertheless, it was still the second-highest sales figure ever for the month of September.
“September provided another month’s worth of evidence from all across Canada that housing market conditions are stabilizing near current levels,” said Cliff Stevenson, Chair of CREA. “In some ways that comes as a relief given the volatility of the last year-and-a-half, but the issue is that demand/supply conditions are stabilizing in a place that very few people are happy about. There is still a lot of demand chasing an increasingly scarce number of listings, so this market remains very challenging."
Housing supply remains a major constraint, forcing many buyers to either pay up for scarce properties or to remain on the sidelines. This is particularly troublesome for first-time homebuyers as mortgage rates are coming under renewed upward pressure as inflation concerns have forced yield curves to steepen and longer-term bond yields to rise worldwide.
New Listings
Exacerbating supply problems, the number of newly listed homes fell by 1.6% in September compared to August, as gains in parts of Quebec were swamped by declines in the Lower Mainland, in and around the GTA and in Calgary.
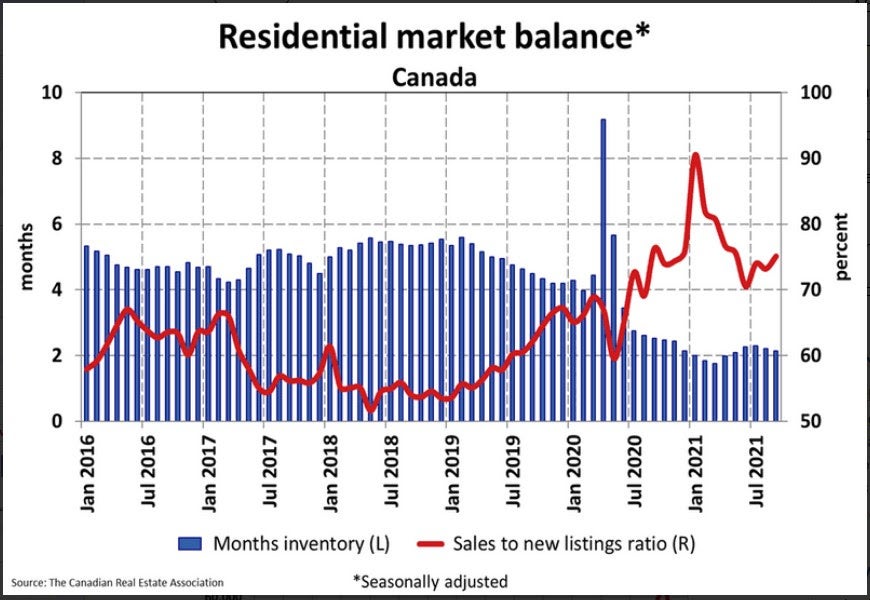
With sales up and new listings down in September, the sales-to-new listings ratio tightened to 75.1% compared to 73.2% in August. The long-term average for the national sales-to-new listings ratio is 54.8%.
Based on a comparison of sales-to-new listings ratio with long-term averages, a small but growing majority of local markets are moving back into seller’s market territory (see chart below). As of September, it was close to a 60/40 split between seller's and balanced markets.
There were 2.1 months of inventory on a national basis at the end of September 2021, down slightly from 2.2 months in August and 2.3 months in June and July. This is extremely low and indicative of a strong seller’s market at the national level and in most local markets. The long-term average for this measure is more than 5 months.
Home Prices
In line with tighter market conditions, the Aggregate Composite MLS® Home Price Index (MLS® HPI) accelerated to 1.7% on a month-over-month basis in September 2021.
The non-seasonally adjusted Aggregate Composite MLS® HPI was up 21.5% on a year-over-year basis in September, up a bit from the 21.3% year-over-year gain recorded in August.
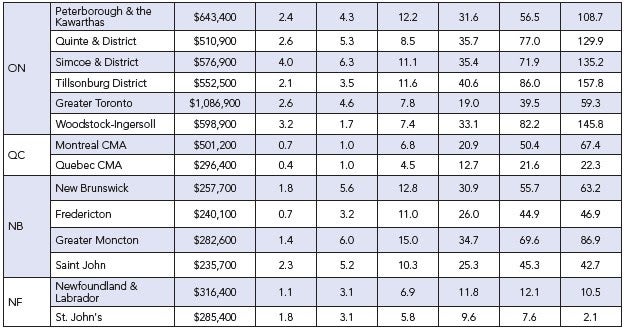
Looking across the country, year-over-year price growth is creeping up above 20% in B.C., though it is lower in Vancouver (13.9%), on par with the provincial number in Victoria, and higher in other parts of the province (see table below).
Year-over-year price gains are in the mid-to-high single digits in Alberta and Saskatchewan, while gains are into the low double digits in Manitoba.
Ontario saw year-over-year price growth pushing 25% in September; however--as with B.C.--big, medium and smaller city trends, gains are notably lower in the GTA (19.0%) and Ottawa (16.4%), around the provincial average in Oakville-Milton (26.9%), Hamilton-Burlington (26.5%) and Guelph (26.4%), and considerably higher in many of the smaller markets around the province.
Greater Montreal’s year-over-year price growth remains at a little over 20%, while Quebec City is now at 12.7%. Price growth is running a little above 30% in New Brunswick (higher in Greater Moncton, a little lower in Fredericton and Saint John), while Newfoundland and Labrador is now at 12% year-over-year (a bit lower in St. John’s).

Bottom Line
Canada continues to contend with one of the developed world’s most severe housing shortages. As our borders open to a resurgence of immigration, excess demand for housing will mount. The impediments to a rapid rise in housing supply, both for rent and purchase, are primarily in the planning and approvals process at the municipal level. Liberal Party election promises do not address these issues.
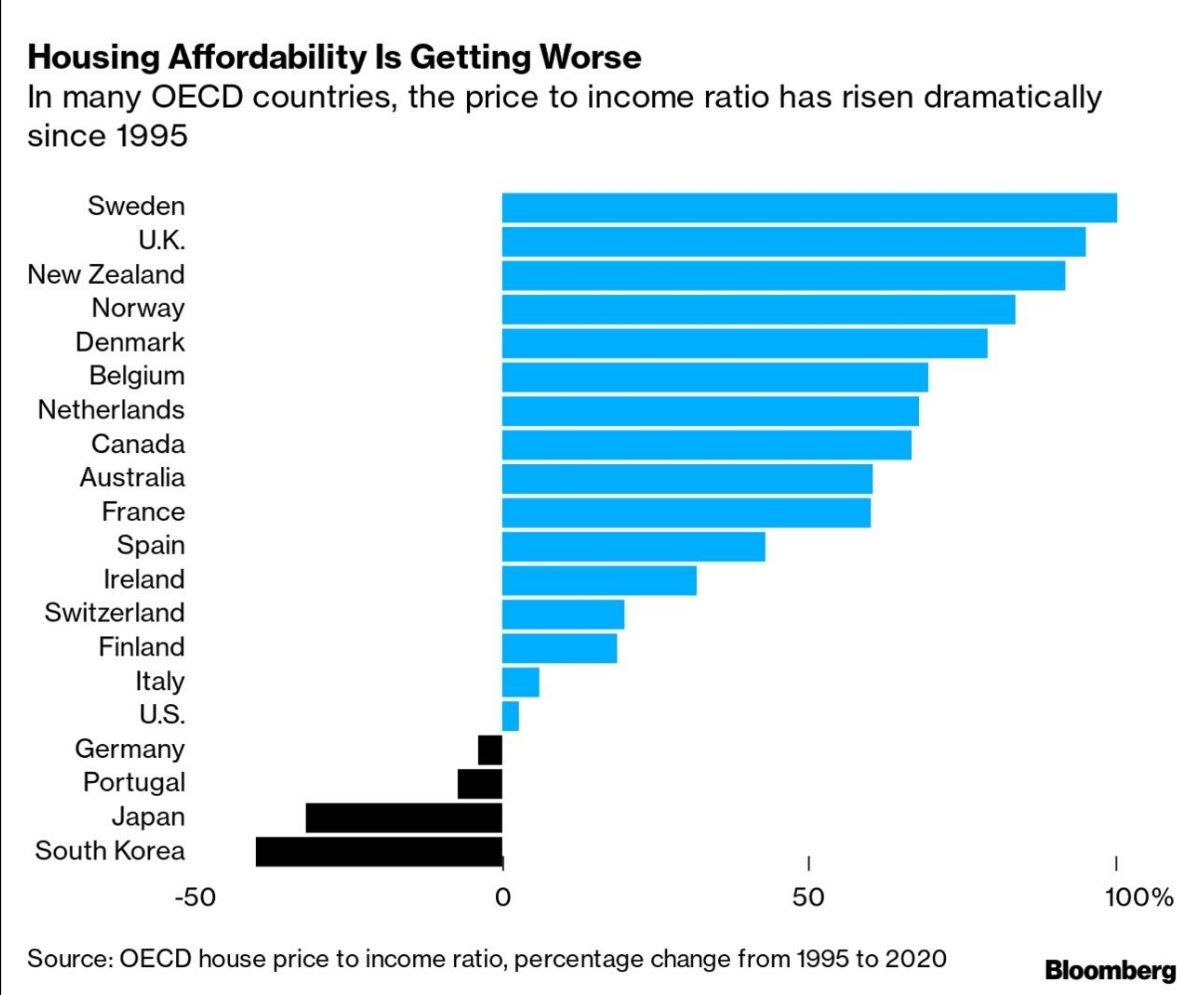
It is noteworthy that while Canada suffers one of the most acute housing shortages, housing affordability is getting worse in many OECD countries (see chart below).
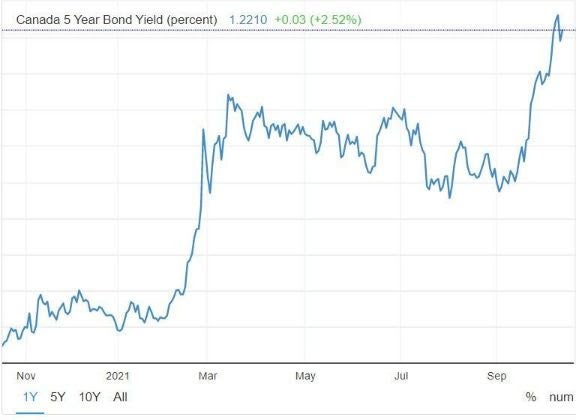
Adding to the affordability problem, interest rates have bottomed as an inflation-induced selloff in bonds mount despite the assertion of most central banks that inflation is temporary. Very recently, Governor Tiff Macklem admitted that inflation is likely to remain a problem until the end of the year.
Some of the inflation is coming from disruptions on the supply side emanating from COVID-related disruptions, which may work themselves out in time. However, they're still getting worse, and many suggest the timeline could be much longer than just this year. In addition, extreme weather events and climate change initiatives--both of which are more or less permanent--have also boosted inflation pressure. Consumer demand for goods and housing and business capital expenditures have surged in the face of labour shortages. Wage rates are beginning to rise. All of this has raised prices spilling into next year. Higher interest rates are likely sustainable even though the Bank of Canada and the Federal Reserve will likely hold overnight rates steady for the next year (see charts below).
Some of the inflation is coming from disruptions on the supply side emanating from COVID-related disruptions, which may work themselves out in time. However, they're still getting worse, and many suggest the timeline could be much longer than just this year. In addition, extreme weather events and climate change initiatives--both of which are more or less permanent--have also boosted inflation pressure. Consumer demand for goods and housing and business capital expenditures have surged in the face of labour shortages. Wage rates are beginning to rise. All of this has raised prices spilling into next year. Higher interest rates are likely sustainable even though the Bank of Canada and the Federal Reserve will likely hold overnight rates steady for the next year (see charts below).

Source - DLC - Dr Sherry Cooper
